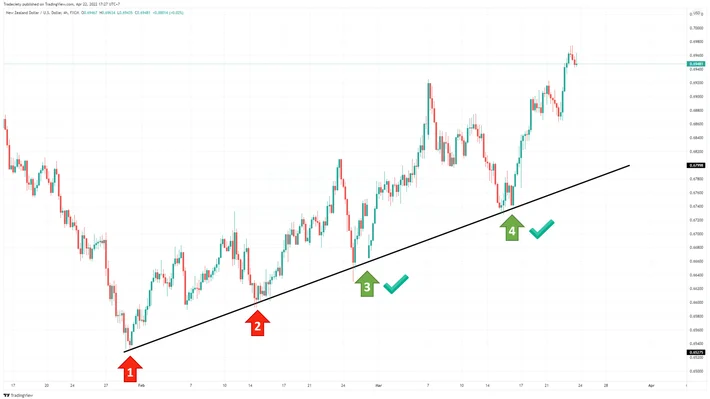
Trendlines and price channels are among the most fundamental yet powerful tools in technical analysis. While horizontal support and resistance levels map static price barriers, trendlines provide a dynamic view of market momentum, revealing the rate at which supply or demand is shifting over time.
When mastered, trendlines and channels help you identify higher-probability entry points, stay on the right side of prevailing trends, and spot major market reversals before they fully unfold.
1. The Anatomy of a Valid Trendline
A common mistake among retail traders is drawing trendlines through arbitrary price points. To use trendlines effectively, you must follow strict structural rules.
+--------------------------------------------------------------------------+
|                     The 3-Step Trendline Validity Rule                   |
+--------------------------------------------------------------------------+
|  • Point 1 (Anchor): The absolute starting swing high or low.             |
|  • Point 2 (Confirmation): The second distinct reaction point.           |
|    ─► At this stage, you have a TENTATIVE trendline (a hypothesis).      |
|  • Point 3 (Validation): The price returns and BOUNCES off the line.    |
|    ─► At this stage, the trendline is VALIDATED and actionable.          |
+--------------------------------------------------------------------------+
Drawing Rules by Trend Direction
-
Uptrend (Bullish Trendline): Drawn along the swing lows beneath the price action. It acts as dynamic support, showing where buyers consistently step in.
-
Downtrend (Bearish Trendline): Drawn along the swing highs above the price action. It acts as dynamic resistance, showing where sellers consistently push back.
Wicks vs. Bodies: Always draw trendlines using candle wicks rather than body closes. Wicks represent the extreme price points where supply or demand imbalance reached its peak.
2. Price Channels: Mapping Market Boundaries
A price channel is formed by adding a parallel line to an existing trendline. While a single trendline shows where price is likely to bounce, a channel defines the entire trading range of an active trend.
                          ASCENDING PRICE CHANNEL

  Channel Resistance ─────────────────────────────────────── (Upper Boundary)
                        /\          /\          /\
                       /  \        /  \        /  \
                      /    \      /    \      /    \
  Channel Support ───/──────\────/──────\────/──────\─────── (Lower Boundary)
                    /        \/          \/          \
                Anchor 1   Touch 2    Touch 3 (BUY)
The Three Types of Channels
-
Ascending Channel (Bullish): Higher highs and higher lows. Look to buy near channel support in line with the trend.
-
Descending Channel (Bearish): Lower highs and lower lows. Look to sell near channel resistance in line with the trend.
-
Horizontal Channel (Ranging): Price moves sideways between parallel support and resistance. Suitable for both range-bound buys at support and sells at resistance.
3. Two Core Trading Strategies
There are two main ways to trade trendlines and channels: The Bounce (Continuation) and The Breakout (Reversal).
Strategy A: The Trendline Bounce (Trend Continuation)
This strategy aims to join an established trend at a discounted price during a pullback.
  STEP-BY-STEP EXECUTION: THE BOUNCE
  -----------------------------------------------------------------------
  1. Identify a validated trendline (3 or more touches).
  2. Wait for price to pull back to the trendline.
  3. Do NOT place blind limit orders at the line.
  4. Look for rejection candles (e.g., Pin Bar, Bullish Engulfing).
  5. Enter on candle close in the direction of the main trend.
  -----------------------------------------------------------------------
-
Stop-Loss Placement: Placed just beyond the outer wick of the rejection candle or below the trendline structure.
-
Take-Profit Target: The previous swing high (for uptrends) or the opposite boundary of the price channel.
Strategy B: The Trendline Breakout (Trend Reversal)
When price fails to respect a trendline and breaks through it decisively, it signals that the dominant force (buyers or sellers) is losing control.
                         TRENDLINE BREAKOUT & RETEST

  Uptrending Price ───/\        /\
                     /  \      /  \
                    /    \    /    \    Breakout Candle
  Trendline ───────/──────\──/──────\───────X───────────────── (Structure Broken)
                           \/        \     / \
                                      \   /   \___ Re-test & Drop (SELL)
                                       \/
The Retest Confirmation Rule
Entering immediately on a breakout candle can lead to “fakeouts” (false breakouts). The safer approach is to wait for the Break-Retest Pattern:
-
Break: Price breaks and closes decisively beyond the trendline on above-average volume.
-
Retest: Price drifts back toward the broken trendline, which now acts in reverse (former support becomes resistance, or vice versa).
-
Rejection: Wait for a reversal candle at the retest point before executing your entry.
4. Key Factors That Increase Reliability
| Factor | High-Probability Setup | Low-Probability Setup |
| Angle of Slope | Around $30^\circ$ to $45^\circ$ (sustainable trend) | Steeper than $60^\circ$ (parabolic, prone to sudden collapses) |
| Number of Touches | 3 to 4 touches (strong validation) | 5+ touches (line gets “weakened” and prone to breaking) |
| Timeframe | Daily / 4-Hour charts (less noise, high institutional backing) | 1-Minute / 5-Minute charts (frequent noise and false breaks) |
| Confluence | Trendline aligns with a horizontal S/R level or Moving Average | Trendline sits in isolated space with no additional support |
3 Critical Mistakes to Avoid
-
Forcing Trendlines to Fit: If a trendline doesn’t line up naturally across clear swing points without cutting through candle bodies, don’t force it. The market isn’t showing a clean trend.
-
Trading Against the Primary Channel: In an ascending channel, taking short positions at the top boundary carries much higher risk than buying at the bottom boundary. Trade with the prevailing channel slope.
-
Ignoring Higher Timeframe Trends: A 15-minute downtrend line moving directly into a 4-hour major support zone is likely to fail. Always check the higher-timeframe context before taking a setup.