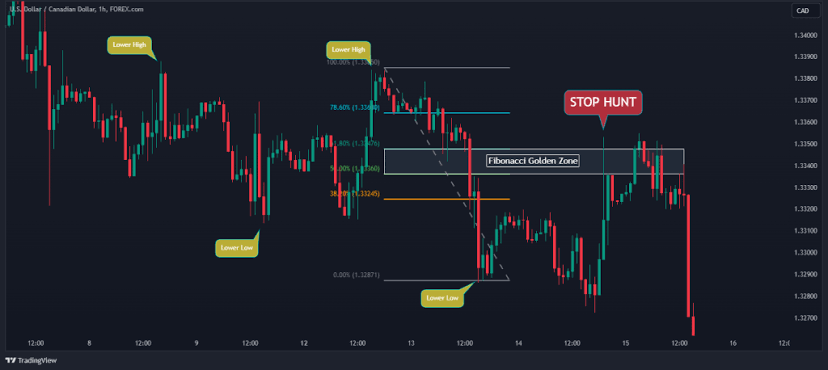
Among the wide array of technical tools used by foreign exchange traders, Fibonacci Retracement stands out as one of the most natural, reliable methods for identifying high-probability entry points. Named after the 13th-century Italian mathematician Leonardo Fibonacci, this tool applies mathematical ratios derived from the Fibonacci sequence to financial price action.
In forex trading, markets rarely move in a straight line. Instead, prices advance or decline in impulse waves, followed by corrective pullbacks. Fibonacci retracement levels allow you to map out where these pullbacks are likely to stall, enabling you to join an ongoing trend at advantageous prices with tight risk parameters.
The Science Behind Fibonacci Ratios
The Fibonacci sequence ($0, 1, 1, 2, 3, 5, 8, 13, 21, 34, 55, 89, \dots$) is formed by adding the previous two numbers together. As the sequence progresses, dividing any number by the number that follows it yields a value approaching $0.618$ ($61.8\%$), often referred to as the Golden Ratio.
  FIBONACCI MATHEMATICAL DERIVATION
  -----------------------------------------------------------------------
  • 34 / 55  = 0.6181  ──►  61.8% Retracement
  • 34 / 89  = 0.3820  ──►  38.2% Retracement
  • 13 / 89  = 0.1460  ──►  23.6% Retracement
  -----------------------------------------------------------------------
Key Retracement Levels on Forex Charts
When you apply the Fibonacci tool to a price swing, charting platforms plot horizontal grid lines corresponding to specific percentage pullbacks:
-
23.6% & 38.2% (Shallow Retracements): Typically occur during strong, fast-moving trends where buying/selling pressure is aggressive and pullbacks are minimal.
-
50.0% (The Psychological Equilibrium): Although not a true Fibonacci ratio mathematically, the $50\%$ level is a critical market benchmark representing a half-way discount.
-
61.8% (The Golden Pocket): The primary retracement level. It is widely considered the highest-probability zone for trend resumption.
-
78.6% (Deep Retracement): Represents a final line of defense for trend continuation before the swing low/high is breached, invalidating the structure.
How to Draw Fibonacci Retracements Correctly
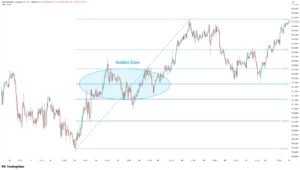
The accuracy of Fibonacci levels depends entirely on identifying the correct structural reference points: the Swing High and the Swing Low.
+--------------------------------------------------------------------------+
|                       Plotting Rules by Market Bias                      |
+--------------------------------------------------------------------------+
|  Uptrend Setup (Looking to Buy Pullbacks):                               |
|  • Click first on the absolute SWING LOW (start of impulse wave).        |
|  • Drag and anchor to the prominent SWING HIGH (peak of move).           |
|                                                                          |
|  Downtrend Setup (Looking to Sell Rallies):                              |
|  • Click first on the absolute SWING HIGH (peak of impulse drop).        |
|  • Drag and anchor to the prominent SWING LOW (bottom of drop).          |
+--------------------------------------------------------------------------+
  BULLISH RETRACEMENT (BUY SETUP)

  Swing High ─────────────────────────────────────────────── (100.0%)
                                 \          /
                                  \        /
  Golden Pocket ───────────────────\──────/───────────────── (61.8% Level)
                                     \  /  ◄── Buy Entry Zone
  Swing Low ──────────────────────────\/──────────────────── (0.0%)
Pinpointing Entries: The Power of Confluence
Plotting a Fibonacci grid in isolation is not a standalone trading signal. Because price can potentially bounce off any of the percentage lines, professional traders look for confluence—a clustering of independent technical factors aligning at the same price zone.
+--------------------------------------------------------------------------+
|                      Building a Confluence Checklist                     |
+--------------------------------------------------------------------------+
|  1. Key Fibonacci Ratio (61.8% or 50.0%)                                 |
|  2. Horizontal Market Structure (Prior Support turned Resistance, or vice versa)|
|  3. Moving Average Alignment (e.g., 50 EMA or 200 SMA floating at level) |
|  4. Reversal Candlestick Confirmation (Pin bar, Engulfing pattern)      |
+--------------------------------------------------------------------------+
Example Setup: The Ideal Bullish Entry
-
Identify Trend: EUR/USD is making higher highs and higher lows on the 4-hour chart.
-
Anchor Swing Points: Draw the Fibonacci tool from the low at $1.0800$ up to the swing high at $1.1000$.
-
Locate Retracement Zone: The $61.8\%$ Golden Ratio sits at $1.0876$.
-
Find Confluence: Looking left on the chart, $1.0875$ served as a major resistance ceiling three days ago, which should now act as dynamic support. Additionally, the 50-period EMA rests precisely at $1.0878$.
-
Trigger Execution: As price pulls back to $1.0876$, wait for a 1-hour Bullish Pin Bar or Engulfing Candle to close before executing a long position.
Setting Dynamic Stop-Loss and Take-Profit Targets
Fibonacci analysis provides clear rules for risk-to-reward structuring:
+--------------------------------------------------------------------------+
|                  Fibonacci Trade Execution Architecture                  |
+--------------------------------------------------------------------------+
|  Position Entry   ──► At or near the 61.8% / 50.0% Confluence Zone      |
|  Stop-Loss        ──► Below the 78.6% level OR past the 100% Swing Low    |
|  Take-Profit 1    ──► Retest of 0.0% (The previous Swing High)          |
|  Take-Profit 2    ──► 127.2% or 161.8% Fibonacci Extension target       |
+--------------------------------------------------------------------------+
Using Fibonacci Extensions ($127.2\%$ and $161.8\%$) allows you to project profit targets past the structural swing high into uncharted territory, ensuring favorable risk-to-reward ratios ($1:2$ or $1:3$).
3 Critical Mistakes to Avoid
| Common Mistake | Why It Fails | Correction |
| 1. Mixing Timeframes Mid-Swing | Anchoring a swing low from a 15-minute chart to a swing high on a 4-hour chart distorts the math. | Keep your anchor points within the exact same timeframe context. |
| 2. Placing Blind Limit Orders | Placing a order directly on the $61.8\%$ line without waiting for price reaction can lead to losses if momentum breaks through. | Always wait for price action confirmation (rejection candles) at the zone. |
| 3. Ignoring Overall Trend Direction | Drawing retracements against a strong macro trend yields low-probability bounce trades. | Only use retracements to trade with the higher timeframe market flow. |