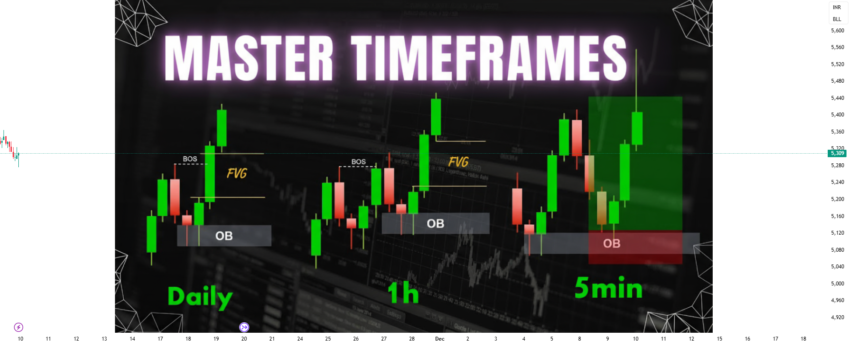
In technical analysis, relying on a single timeframe is like trying to navigate a city with a microscope. A 5-minute chart might show a clear downtrend, prompting a short entry, while the daily chart shows the exact same price resting on a major multi-month support level. Within minutes, the higher-timeframe buyers step in, wiping out the short trade.
Multi-Timeframe Analysis (MTFA) solves this problem by analyzing the same financial asset across different timeframes. By combining higher-timeframe context with lower-timeframe execution, traders can align themselves with institutional momentum, eliminate market noise, and pinpoint entries with minimal risk exposure.
The Core Philosophy: The Top-Down Approach
Multi-timeframe analysis operates on a top-down hierarchy. Higher timeframes carry more weight, provide greater statistical reliability, and dictate the dominant market direction. Lower timeframes provide precision, allowing for tight stop-loss placement and refined execution.
+--------------------------------------------------------------------------+
|                       The Top-Down Analysis Funnel                       |
+--------------------------------------------------------------------------+
|  1. DAILY CHART (Macro Context & Trend)                                  |
|     ─► Determines the directional bias: Are we Buying or Selling?        |
|     ─► Marks major historical Support & Resistance zones.                |
|                                                                          |
|  2. 1-HOUR / 4-HOUR CHART (Intermediate Structure)                       |
|     ─► Maps the current wave structure and pullback progression.         |
|     ─► Identifies key confluence areas within the daily trend.          |
|                                                                          |
|  3. 5-MIN / 15-MIN CHART (Intraday Execution)                            |
|     ─► Finds precise entry triggers (Candlestick Rejections, Breakouts). |
|     ─► Sets tight stop-loss levels and initial risk parameters.          |
+--------------------------------------------------------------------------+
Selecting Your Timeframe Combination (The Rule of 4 or 5)
A common mistake among retail traders is jumping across too many random timeframes—such as analyzing the Monthly, 1-Hour, 3-Minute, and 10-Second charts simultaneously. This leads to severe analysis paralysis.
A good rule of thumb is the Factor of 4 to 6 Ratio. Your execution timeframe should be approximately $\frac{1}{4}\text{th}$ to $\frac{1}{6}\text{th}$ of your context timeframe.
  POPULAR MULTI-TIMEFRAME COMBINATIONS
  -----------------------------------------------------------------------
  • Position / Swing Trader:   Weekly (Macro)  ──► Daily (Context)  ──► 4-Hour (Entry)
  • Classic Day Trader:        Daily (Macro)   ──► 1-Hour (Context) ──► 5-Min (Entry)
  • Scalper:                   4-Hour (Macro)  ──► 15-Min (Context) ──► 1-Min (Entry)
  -----------------------------------------------------------------------
Step-by-Step Blueprint: Daily to Intraday Integration
Here is how to combine the Daily, 1-Hour, and 5-Minute charts into a cohesive trading plan.
                          MULTIPLE TIMEFRAME ALIGNMENT

  [Daily Chart]       Uptrend (Higher Highs / Higher Lows)  ──► BIAS: BULLISH
                                   │
  [1-Hour Chart]      Pullback into Daily Support Zone       ──► SETUP: READY
                                   │
  [5-Minute Chart]    Bullish Engulfing or Trendline Break   ──► ENTRY: EXECUTE
Step 1: Establish Macro Bias on the Daily Chart
Open a clean Daily chart and answer three fundamental questions:
-
What is the current market structure? (Is price making Higher Highs/Higher Lows or Lower Highs/Lower Lows?)
-
Where are the key historical levels? Mark major Daily Support and Resistance zones.
-
What is our bias today? If the Daily chart is in a strong uptrend, your default operational rule for intraday sessions should be Long positions only.
Step 2: Map the Intermediate Zone on the 1-Hour Chart
Switch to the 1-Hour timeframe to observe how price is behaving as it approaches your Daily levels.
-
Look for pullbacks into value: Wait for price on the 1-Hour chart to pull back into a key Daily Support level or a key moving average (such as the 20 or 50 EMA).
-
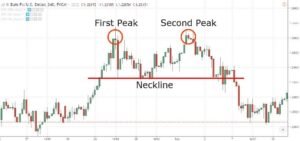
Identify intermediate patterns: Look for 1-Hour consolidation, descending wedges, or double bottoms forming directly on the Daily support zone.
Step 3: Pinpoint the Trigger on the 5-Minute Chart
Once price reaches your 1-Hour / Daily confluence zone, zoom in to the 5-Minute chart to trigger your trade.
-
Wait for a structural shift: On the 5-Minute chart, look for a Change of Character (ChoCh)—such as a break above a local lower high.
-
Look for a candlestick trigger: Execute on a 5-Minute Bullish Pin Bar, Engulfing pattern, or a break out of a tight intraday range.
-
Place the Stop-Loss: Because you enter on the 5-Minute chart, your stop-loss can be placed tightly below the local 5-Minute swing low rather than requiring a wide Daily stop-loss.
The Risk-to-Reward Advantage of MTFA
The greatest mathematical edge of combining Daily and Intraday charts is the dramatic improvement in your Risk-to-Reward Ratio ($R:R$).
$$\text{Risk-to-Reward Ratio} = \frac{\text{Take-Profit Distance (Daily Target)}}{\text{Stop-Loss Distance (Intraday Risk)}}$$
+--------------------------------------------------------------------------+
|                     Single vs. Multi-Timeframe Trade                     |
+--------------------------------------------------------------------------+
|  Daily-Only Entry:                                                       |
|  • Entry: $100.00 | Stop-Loss: $95.00 (Risk: $5.00)                       |
|  • Target: $110.00 (Reward: $10.00) ──► Risk-to-Reward = 1:2             |
|                                                                          |
|  MTFA Execution (Daily Context + 5-Min Entry):                           |
|  • Entry: $96.50  | Stop-Loss: $95.50 (Risk: $1.00)                       |
|  • Target: $110.00 (Reward: $13.50) ──► Risk-to-Reward = 1:13.5          |
+--------------------------------------------------------------------------+
Summary Matrix: MTFA Execution
| Analysis Phase | Timeframe | Primary Goal | Actionable Output |
| 1. Macro Context | Daily Chart | Determine overall trend and key structural levels | Establish directional bias (Long or Short only) |
| 2. Intermediate Setup | 1-Hour / 4-Hour | Monitor pullback progression into key zones | Confirm price has arrived at a high-confluence area |
| 3. Execution Trigger | 5-Minute / 15-Minute | Find precise entry signal and micro structure shift | Execute position with tight stop-loss parameters |
3 Critical Rules to Avoid MTFA Pitfalls
-
Never Trade Against the Higher Timeframe: Taking a 5-minute short trade when the Daily chart is in a raging uptrend is a low-probability play. Trade with the higher-timeframe flow.
-
Do Not Over-Analyze Lower Timeframes: Use the 5-minute chart only when price has reached your predetermined Daily/1-Hour zone. Staring at 5-minute candles in the middle of nowhere creates confusion and overtrading.
-
Align Your Expectations: Higher-timeframe targets take time to materialize. If your entry is based on a Daily target, be prepared to hold the position across session boundaries, even if you entered on a 5-minute chart.