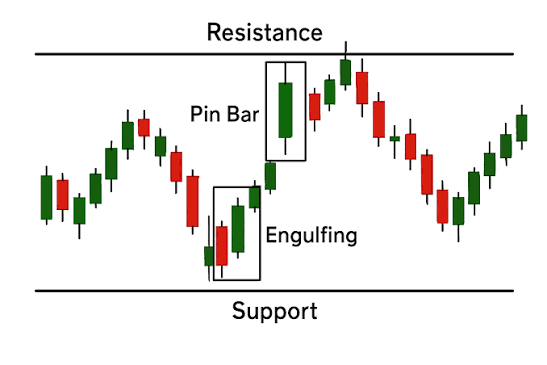
In a world filled with thousands of technical indicators—from Stochastic Oscillators to MACD and Bollinger Bands—Price Action Trading strips away the clutter. It is the discipline of making trading decisions based purely on historical price movement displayed on a clean, indicator-free price chart—often referred to as a “naked chart.”
Rather than relying on lagging indicators that perform calculations on past data, price action traders analyze raw price movements, candlestick shapes, market structure, and key support and resistance zones to understand the real-time balance of power between buyers and sellers.
1. Why Trade “Naked”? The Core Philosophy
Most technical indicators are lagging, meaning they calculate past price points to draw lines on a screen. By the time a moving average crossover or RSI divergence registers, the ideal trade entry has often already passed.
+--------------------------------------------------------------------------+
|                     Indicators vs. Naked Price Action                    |
+--------------------------------------------------------------------------+
|  Indicator-Based Trading:                                                |
|  Price Moves ──► Mathematical Formula ──► Line Drawn ──► Delayed Decision|
|                                                                          |
|  Naked Price Action Trading:                                             |
|  Price Moves ──► Direct Chart Reaction ──► Instant Real-Time Decision    |
+--------------------------------------------------------------------------+
Key Advantages of Naked Chart Trading
-
Zero Analysis Paralysis: Eliminates conflicting signals (e.g., when one indicator says “buy” while another says “sell”).
-
Leading Context: Allows you to anticipate market moves at major structural levels before indicator lines catch up.
-
Universal Application: Works across all asset classes—Forex, stocks, crypto, commodities—and across all timeframes.
2. The Core Building Blocks of Price Action
To trade naked charts effectively, you need to master three fundamental concepts: Market Structure, Key Levels, and Trigger Candlesticks.
                           THE PRICE ACTION TRIAD

                    / \
                   /   \
                  /     \
                 /  KEY  \
                / LEVELS  \
               /-----------\
              /   MARKET    \
             /  STRUCTURE    \
            /-----------------\
           /     TRIGGER       \
          /   CANDLESTICKS      \
         /-----------------------\
A. Market Structure (The Big Picture)
Market structure tells you who is currently in control:
-
Uptrend: Characterized by a sequence of Higher Highs (HH) and Higher Lows (HL).
-
Downtrend: Characterized by a sequence of Lower Highs (LH) and Lower Lows (LL).
-
Consolidation (Range): Price is trapped between a horizontal ceiling (resistance) and floor (support).
B. Horizontal Key Levels (The Location)
Draw static horizontal lines at structural price zones where the market has previously made sharp turns or violent rejections.
-
Support: Price levels where buying demand historically outweighs selling supply.
-
Resistance: Price levels where selling supply historically outweighs buying demand.
-
Role Reversal (Support/Resistance Flip): When broken, former support becomes dynamic future resistance (and vice versa).
3. Top 3 Naked Chart Strategies
Once you identify the market structure and mark your key levels, you need a high-probability trigger pattern to confirm an entry.
Strategy 1: The Pin Bar Rejection
A Pin Bar (Pinocchio Bar) features a very long wick pointing in one direction and a small body near the opposite end. The long wick shows that one side tried to drive price far in one direction, but was aggressively overpowered and rejected by the other side.
       BULLISH PIN BAR                     BEARISH PIN BAR

          Upper Wick (Small)                  Small Real Body
             ┌───┐                               ┌───┐
             │   │ Real Body                     │   │
             └───┘                               └───┘
               │                                   │
               │                                   │
               │  Long Lower Wick                  │  Long Upper Wick
               │  (Rejection of                    │  (Rejection of
               │   Lower Prices)                   │   Higher Prices)
               │                                   │
  EXECUTION RULES: BULLISH PIN BAR AT SUPPORT
  -----------------------------------------------------------------------
  1. Context: Market is in an uptrend, pulling back to a major Support level.
  2. Trigger: A Bullish Pin Bar forms with its tail protruding through Support.
  3. Entry: Buy on the close of the Pin Bar (or on a 50% limit retracement of the wick).
  4. Stop-Loss: Placed 5 to 10 pips below the lowest point of the Pin Bar wick.
  5. Target: Next major structural Resistance level (aiming for at least 1:2 R:R).
  -----------------------------------------------------------------------
Strategy 2: The Engulfing Bar (Momentum Shift)
An Engulfing Pattern is a two-candle reversal setup where the body of the second candle completely swallows or “engulfs” the real body of the first candle.
                  BULLISH ENGULFING PATTERN

                    Small Bearish        Large Bullish
                     First Candle        Second Candle
                                            ┌───────┐
                       ┌───┐                │       │
                       │   │                │       │
                       └───┘                │       │
                                            └───────┘
-
Bullish Engulfing: Forms at a key support zone during a pullback in an uptrend. Signals that buyers have completely overrun sellers.
-
Bearish Engulfing: Forms at a key resistance zone during a rally in a downtrend. Signals an aggressive influx of institutional sellers.
Strategy 3: The Inside Bar (Volatility Compression Breakout)
An Inside Bar is a candle whose entire high-to-low range falls strictly within the range of the preceding candle (the “Mother Bar”). It represents a contraction in volatility before an explosive breakout.
                       INSIDE BAR SETUP

                       Mother Bar         Inside Bar
                         ┌───┐
                         │   │               ┌───┐
                         │   │               │   │
                         │   │               └───┘
                         └───┘
  HOW TO TRADE THE INSIDE BAR BREAKOUT:
  -----------------------------------------------------------------------
  • Continuous Trend Context: Identify a strong trending market.
  • Consolidation: Wait for an Inside Bar to form near a structural level or EMA.
  • Trigger Order:
    - Place a Buy Stop pending order slightly above the Mother Bar High.
    - Place a Sell Stop pending order slightly below the Mother Bar Low.
  -----------------------------------------------------------------------
Price Action Strategy Blueprint
| Strategy | Market Context | Trigger Candle | Primary Stop-Loss | Target Location |
| Pin Bar Rejection | Re-test of key Support or Resistance | Long-tailed candle rejecting level | Past the extreme tip of the wick | Prior Swing High / Low |
| Engulfing Bar | Pullback completion in established trend | Large candle swallowing previous body | Past the low/high of the engulfing bar | Next major structure zone |
| Inside Bar | Consolidation before trend continuation | Small candle contained within Mother Bar | Opposite side of the Mother Bar | 2x risk distance ($1:2$ Minimum) |
Summary Checklist for Price Action Traders
Before taking any trade on a naked chart, verify this 4-step framework:
-
Trend: Is the market making Higher Highs / Higher Lows or Lower Highs / Lower Lows?
-
Level: Is price currently reacting to a major historical Support or Resistance line?
-
Signal: Has a clear price action candle (Pin Bar, Engulfing, or Inside Bar) closed at that level?
-
Risk-to-Reward: Does the trade offer at least a $1:2$ Risk-to-Reward ratio to the next structural boundary?