While technical indicators perform mathematical calculations on historical prices, chart patterns allow traders to read raw price action directly. Chart patterns are distinct geometric formations created by price movements over time. They represent the collective psychology of market participants—visualizing the ongoing tug-of-war between buyers (bulls) and sellers (bears).
By recognizing these recurring structures, traders can anticipate high-probability market turns, breakout direction, and potential profit targets. Chart patterns generally fall into two categories:
-
Reversal Patterns: Signal that an existing trend is losing momentum and about to change direction.
-
Continuation Patterns: Signal that the market is temporarily taking a breather before resuming its primary trend.
1. Reversal Patterns
Reversal patterns form at the end of established trends, signaling an exhaustion of market momentum and an impending shift in market structure.
A. The Head and Shoulders (and Inverse Head and Shoulders)
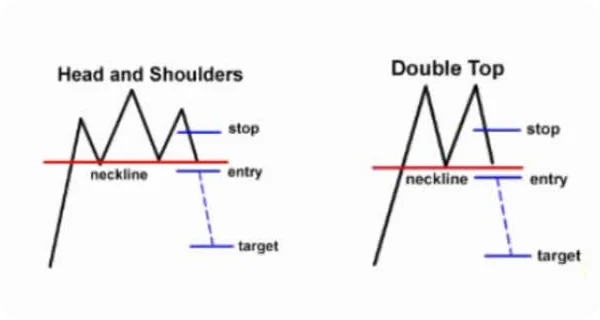
The Head and Shoulders pattern is widely regarded as one of the most reliable trend-reversal patterns in technical analysis. It marks the transition from a bullish market structure (higher highs and higher lows) to a bearish market structure.
                  HEAD AND SHOULDERS (BEARISH REVERSAL)

                        Head
                         /\
                        /  \
           Left        /    \        Right
          Shoulder    /      \      Shoulder
             /\      /        \        /\
            /  \    /          \      /  \
  ─────────/────\──/────────────\────/────\───────── Neckline
                 \/              \/        \
                                            \___ Breakout / Short Entry
Anatomical Breakdown
-
Left Shoulder: Price rallies to a peak, followed by a minor pullback.
-
Head: Price rallies past the previous peak to form a higher high, followed by another decline back to the support level.
-
Right Shoulder: Price rallies again, but buyers fail to reach the height of the Head. Price drops back toward support.
-
Neckline: The support line connecting the reaction lows between the shoulders.
Trading Execution: A Short entry is triggered when price decisively breaks and closes below the Neckline.$$\text{Measured Target} = \text{Neckline Price} – (\text{Head Peak Price} – \text{Neckline Price})$$
Inverse Head and Shoulders
The exact opposite structure occurs at the bottom of a downtrend, signaling a transition from a bear market to a bull market. The entry triggers on a breakout above the Neckline.
B. Double Tops and Double Bottoms
Double Tops and Double Bottoms are classic “M” and “W” patterns that signal market rejection at structural price levels.
+--------------------------------------------------------------------------+
|                       Double Top vs. Double Bottom                       |
+--------------------------------------------------------------------------+
|  Double Top ("M" Pattern)         |  Double Bottom ("W" Pattern)         |
|  ------------------------         |  ---------------------------         |
|  • Occurs at peak of uptrend.     |  • Occurs at base of downtrend.      |
|  • Price hits resistance TWICE    |  • Price hits support TWICE          |
|    and fails to break higher.     |    and fails to break lower.         |
|  • Signal: Bearish Reversal.      |  • Signal: Bullish Reversal.         |
|  • Trigger: Break below Neckline  |  • Trigger: Break above Neckline     |
+--------------------------------------------------------------------------+
     DOUBLE TOP ("M" PATTERN)               DOUBLE BOTTOM ("W" PATTERN)

     Peak 1      Peak 2                                 Neckline
       /\          /\                         ─────────/\──────────
      /  \        /  \                                /  \
     /    \  /\  /    \                              /    \  /\  /
    /      \/  \/      \                            /      \/  \/
  ─/────────────────────\─ Neckline                Bottom 1  Bottom 2
                         \___ Short Entry
2. Continuation & Breakout Patterns: Triangles
Unlike reversal structures, Triangles are volatility compression patterns. As price action contracts into tighter boundaries, energy builds up within the market until an explosive breakout occurs.
A. Ascending Triangle (Bullish Bias)
An Ascending Triangle features a flat horizontal resistance ceiling at the top and a series of rising higher lows along the bottom.
-
Market Psychology: Sellers are defending a specific price level, but buyers are becoming increasingly aggressive, stepping in at higher prices on every dip.
-
Trading Trigger: Look for a high-volume breakout above the horizontal resistance ceiling.
                       ASCENDING TRIANGLE

  Resistance ────────────────────────────────────────────── Flat Top
                /\        /\        /\      /
               /  \      /  \      /  \    /
              /    \    /    \    /    \  /___ Bullish Breakout
             /      \  /      \  /      \/
  Higher Lows ───────\/────────\/────────────────────────── Rising Trendline
B. Descending Triangle (Bearish Bias)
A Descending Triangle is the inverse of the ascending structure. It features a flat horizontal support floor at the bottom and a descending series of lower highs along the top.
-
Market Psychology: Buyers are trying to hold a support level, but sellers are aggressively driving prices down to lower peaks, steadily applying pressure to the floor.
-
Trading Trigger: Look for a breakdown below the flat horizontal support floor.
                      DESCENDING TRIANGLE

  Lower Highs ───────\────────\/────────────────────────── Falling Trendline
                      \      / \      / \
                       \    /   \    /   \
                        \  /     \  /     \___ Bearish Breakdown
  Support ───────────────\/───────\/────────────────────── Flat Floor
C. Symmetrical Triangle (Bi-Directional / Neutral)
A Symmetrical Triangle is formed by two converging trendlines: falling lower highs along the top and rising higher lows along the bottom.
-
Market Psychology: Neither buyers nor sellers hold clear control. The market is consolidating in a state of equilibrium.
-
Trading Trigger: Do not guess the direction in advance. Wait for a definitive candle close outside either side of the converging trendlines before entering in the direction of the breakout.
                      SYMMETRICAL TRIANGLE

                     \                  /
                      \    /\    /\    /
                       \  /  \  /  \  /___ Potential Breakout Direction
                        \/    \/    \/
                       /              \
                      /                \
Pattern Comparison & Execution Summary
| Pattern Name | Pattern Type | Market Context | Entry Trigger Point | Measured Move Target |
| Head & Shoulders | Reversal | Top of Uptrend | Candle close below Neckline | Distance from Head to Neckline |
| Double Top | Reversal | Top of Uptrend | Break below the central low | Height from Peaks to Neckline |
| Double Bottom | Reversal | Base of Downtrend | Break above the central high | Height from Bottoms to Neckline |
| Ascending Triangle | Continuation | Uptrend / Accumulation | Breakout above Flat Resistance | Height of the back (widest part) of triangle |
| Descending Triangle | Continuation | Downtrend / Distribution | Breakdown below Flat Support | Height of the back (widest part) of triangle |
| Symmetrical Triangle | Neutral | Consolidation Phase | Breakout of upper OR lower line | Height of the back (widest part) of triangle |
3 Rules for Trading Chart Patterns Successfully
-
Always Wait for the Candle Close: Never enter a trade while a breakout candle is still forming. False breakouts (“fakeouts”) happen frequently when price briefly spikes past a line before pulling back inside the pattern structure.
-
Look for Volume Confirmation: True breakouts are accompanied by a sharp surge in trading volume. A breakout on low volume suggests a lack of institutional backing and a higher risk of failure.
-
Combine Patterns with Horizontal Support/Resistance: A Head and Shoulders pattern that forms at a major multi-year resistance level carries far greater statistical significance than one forming in the middle of a weak intraday trend.