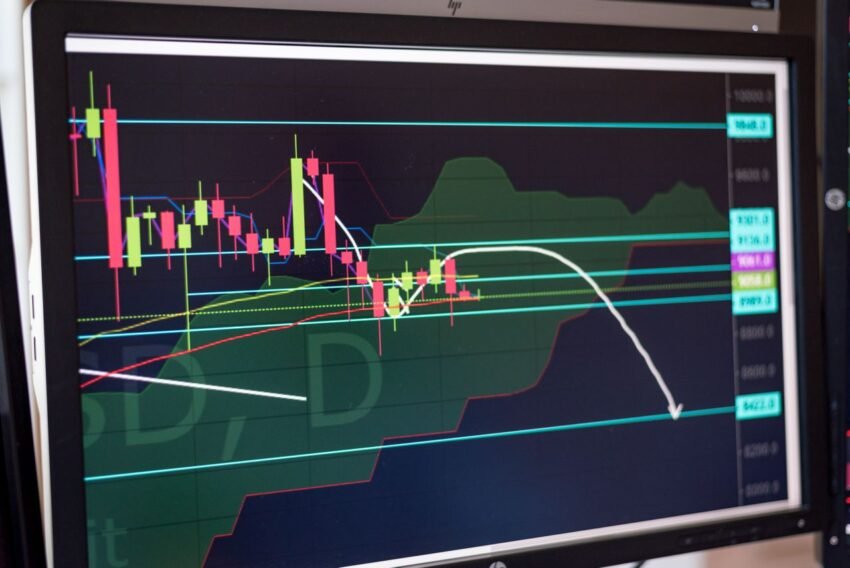
In technical analysis, Support and Resistance (S/R) form the core foundation of chart reading. Whether you are trading forex, equities, or commodities, market prices do not move in a straight line—they move in waves driven by shifts in supply and demand.
Understanding where demand overwhelms supply (Support) and where supply overwhelms demand (Resistance) allows traders to map out high-probability entry points, clear price targets, and logical stop-loss locations.
What are Support and Resistance?
+--------------------------------------------------------------------------+
|                      Support vs. Resistance Dynamics                     |
+--------------------------------------------------------------------------+
|  RESISTANCE LEVEL (Ceiling)                                              |
|  • Concentration of Sellers (Supply > Demand)                            |
|  • Prevents prices from pushing higher                                   |
|                                                                          |
|                             ▲   ▲   ▲   (Price Bounces Down)             |
|                             │   │   │                                    |
|                             │   │   │                                    |
|                             ▼   ▼   ▼   (Price Bounces Up)               |
|                                                                          |
|  SUPPORT LEVEL (Floor)                                                   |
|  • Concentration of Buyers (Demand > Supply)                             |
|  • Prevents prices from dropping lower                                   |
+--------------------------------------------------------------------------+
1. Support (The Price Floor)
Support is a price level or region where buying interest is strong enough to overcome selling pressure. When price falls toward support, buyers enter the market (or sellers take profit), causing the downward momentum to stall or reverse upward.
2. Resistance (The Price Ceiling)
Resistance is a price level or region where selling pressure overrides buying momentum. As price rallies toward resistance, sellers step in (or buyers exit long positions), causing the upward movement to pause or turn downward.
Why Think in “Zones” Instead of Exact Lines?
A common beginner mistake is drawing support and resistance as razor-thin, single lines. Because price action is influenced by thousands of market participants with varying account sizes and order execution types, price rarely turns at an exact cent or pip level.
Treat support and resistance as zones or bands rather than fixed price points:
-
Price Overshoots: Market makers often push price slightly past a obvious level to sweep liquidity (stop-loss orders) before reversing.
-
Wicks vs. Bodies: Candlestick wicks show extreme price rejection, while candle bodies show accepted value. Drawing a zone around both the wicks and bodies accounts for market volatility.
How to Identify Support and Resistance Levels
+-------------------------------------------------------------------------+
|                  4 Major Types of Support & Resistance                  |
+-------------------------------------------------------------------------+
|  1. Horizontal Swing Highs & Lows (Historical Price Pivots)              |
|  2. Dynamic S/R (Moving Averages: 50 EMA, 200 EMA)                       |
|  3. Psychological Levels (Round Numbers like 1.1000, $100, $2000)        |
|  4. Trendlines & Channels (Diagonal Price Slopes)                        |
+-------------------------------------------------------------------------+
1. Horizontal Swing Highs and Lows
Look at a higher-timeframe chart (such as the Daily or 4-Hour chart) and mark prominent peak points (swing highs) and valley points (swing lows) where price made sharp direction changes.
-
Touch Count: The more times a level touches and respects a level without breaking it, the more validated that zone becomes.
2. Dynamic Support and Resistance
Unlike static horizontal lines, dynamic levels shift as new price bars form.
-
Moving averages—such as the 50-period Exponential Moving Average (EMA) or 200-period EMA—act as dynamic support during uptrends and dynamic resistance during downtrends.
3. Psychological Round Numbers
Human psychology plays a major role in order placement. Traders naturally place limit orders and stop-losses near clean, round numbers (e.g., EUR/USD at 1.0500, Gold at $2,500, or Bitcoin at $60,000). These institutional “big figures” inherently create natural S/R zones.
4. Role Reversal (The Flip Zone)
When a strong support level breaks down, it frequently flips to become new resistance. Conversely, when a major resistance zone breaks upward, it flips to become new support.
  Upward Breakout:
  Resistance Level  ────► [BREAKOUT] ────► Retest as NEW Support ────► Continuation Up

  Downward Breakdown:
  Support Level     ────► [BREAKDOWN] ───► Retest as NEW Resistance ──► Continuation Down
How to Trade Support and Resistance: 2 Core Strategies

There are two primary methods for trading key zones: The Bounce (Range) and The Breakout.
Strategy 1: Trading the Bounce (Range Trading)
This strategy buys near support or sells near resistance while price remains confined within a consolidation range.
+--------------------------------------------------------------------------+
|                       Trading the Bounce Setup                           |
+--------------------------------------------------------------------------+
|  1. Identify a clean horizontal range with at least 2 prior touches.     |
|  2. Wait for price to enter the Support Zone.                            |
|  3. Look for a bullish candlestick confirmation (e.g., Hammer, Engulfing).|
|  4. Execution:                                                           |
|     • Entry: Close of confirmation candle.                               |
|     • Stop-Loss: Just below the lowest wick of the support zone.         |
|     • Take-Profit: Just below the opposing Resistance Zone.              |
+--------------------------------------------------------------------------+
Strategy 2: Trading the Breakout & Retest
When price breaks through a key S/R zone with high volume and momentum, it often signals the start of a new trend.
-
The Trap: Entering directly on the breakout candle carries high risk of a “fakeout” (false breakout).
-
The Solution (Retest Entry): Wait for price to break out, pull back to retest the broken zone from the opposite side, and confirm rejection before entering.
                      [Higher High]
                           ▲
                          /
     Retest Entry ───►   /
                        /  (Bounces off Broken Level)
  ─────────────────────┴──────────────────────  Resistance-Turned-Support
                      /
                     /
                    / (Strong Momentum Candle)
  ─────────────────┘
  Prior Consolidation
Risk Management Rules for S/R Trading
| Trade Rule | Execution Principle |
| 1. Always Place Stops Outside Zones | Position your Stop-Loss safely past the entire support/resistance band, not directly on the line. |
| 2. Higher Timeframes Rule | S/R zones drawn on Daily and 4-Hour charts carry far more structural weight than levels on a 5-minute chart. |
| 3. Mind the Trend | Take “Bounce” trades in alignment with the higher-timeframe trend (e.g., buy support in an overall uptrend). |