
Candlestick charts are the foundational language of technical analysis in forex trading. Originating in 18th-century Japan to track rice prices, candlesticks provide a visual representation of market sentiment, price momentum, and the ongoing tug-of-war between buyers (bulls) and sellers (bears).
Mastering how to read individual candles and multi-candle formations allows traders to spot potential trend reversals, continuations, and key entry/exit zones before price moves significantly.
Anatomy of a Candlestick
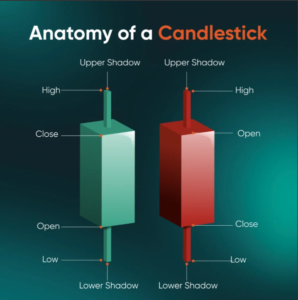
Every candlestick represents price action over a specific timeframe (e.g., 1 minute, 1 hour, 1 day). Regardless of timeframe, every candle communicates four key data points: the Open, High, Low, and Close (OHLC).
Key Structural Components
-
Real Body: The wide central section measuring the distance between the Open price and Close price.
-
Bullish Candle (Green/White): Closes higher than it opened ($\text{Close} > \text{Open}$).
-
Bearish Candle (Red/Black): Closes lower than it opened ($\text{Close} < \text{Open}$).
-
-
Shadows (Wicks or Tails): The thin vertical lines projecting above and below the body.
-
Upper Shadow: Represents the session’s highest price reached.
-
Lower Shadow: Represents the session’s lowest price reached.
-
Single-Candle Patterns
Single-candle formations highlight immediate shifts in momentum or rejection at price levels.
+--------------------------------------------------------------------------+
|                          Single-Candle Patterns                          |
+--------------------------------------------------------------------------+
|  Pattern       Appearance                    Market Significance         |
|  ------------  ----------------------------  --------------------------- |
|  Hammer        Small body at top, long lower  Bullish reversal after a    |
|                shadow (2-3x body length)     downtrend (rejection of low)|
|                                                                          |
|  Shooting Star Small body at bottom, long    Bearish reversal after an   |
|                upper shadow                  uptrend (rejection of high) |
|                                                                          |
|  Doji          Cross-shaped; Open and Close  Indecision / balance        |
|                prices are virtually equal    between buyers and sellers  |
+--------------------------------------------------------------------------+
1. The Hammer (Bullish Reversal)
Occurs at the bottom of a downtrend. Sellers initially push prices lower, but aggressive buying pressure steps in to drive the price back up before the session closes.
-
Signal: Rejection of lower prices; signals potential upward reversal.
2. The Shooting Star (Bearish Reversal)
Occurs at the peak of an uptrend. Buyers push prices higher, but strong selling pressure overrides them, forcing the candle to close near its open.
-
Signal: Rejection of higher prices; signals potential downward reversal.
3. The Doji (Market Indecision)
Formed when the open and close prices are nearly identical, resulting in a thin horizontal line for a body. It indicates equilibrium between buyers and sellers.
-
Signal: Pause in momentum; often precedes a breakout or trend reversal when found at key support/resistance zones.
Essential Multi-Candle Patterns
Multi-candle patterns combine two or more candles to confirm market momentum and trend shifts.
+-------------------------------------------------------------------------+
|                        Multi-Candle Formations                          |
+-------------------------------------------------------------------------+
|  1. Bullish Engulfing: Small red candle fully enclosed by a large green |
|     candle. Signals powerful buyer takeover at support.                 |
|                                                                         |
|  2. Bearish Engulfing: Small green candle fully enclosed by a large red |
|     candle. Signals strong seller takeover at resistance.               |
|                                                                         |
|  3. Morning Star: 3-candle bottom pattern (Red -> Doji/Small -> Green). |
|     Confirms bullish momentum reversal.                                 |
|                                                                         |
|  4. Evening Star: 3-candle top pattern (Green -> Doji/Small -> Red).    |
|     Confirms bearish momentum reversal.                                 |
+-------------------------------------------------------------------------+
Bullish vs. Bearish Engulfing Patterns
-
Bullish Engulfing: A two-candle pattern where a small bearish candle is followed immediately by a larger bullish candle whose body completely overlaps (“engulfs”) the previous candle’s body.
-
Bearish Engulfing: A two-candle pattern where a small bullish candle is completely engulfed by a large, aggressive bearish candle.
Best Practices for Trading Candlestick Patterns
| Rule | Execution Principle |
| 1. Always Wait for Candle Close | Never enter a trade based on an incomplete candle; long wicks can change shape right before the period ends. |
| 2. Combine with Technical Context | A hammer or engulfing pattern is far more reliable when it forms at key Support/Resistance levels or moving averages. |
| 3. Look for Multi-Timeframe Confluence | Confirm short-term patterns (e.g., 15-minute chart) against higher timeframe trends (e.g., 4-hour or Daily chart). |